The goal of this blog is to identify medium term tops and bottoms in the markets. I use a variety of technical indicators to confirm turn dates identified on the 2013 Roadmaps. This blog will always remain free as the intent is that the market is the one who pays me, not you. TimetheTrade (aka TTT) is born. SS76

Sunday, 27 January 2013

S&P Finally Ready


This past week, the tune of 85 Billion dollars fueling the markets continued driving up the S&P past the expected decline of the primary roadmap, now calling this into question.  W.D. Gann always regarded the 60 yr cycle to be the most important, and that would align to the alternate roadmap which the current market levels and recent behaviour seems to be moving towards.  Both roadmaps predict a decline into late February early March so neither is invalidated at the moment, however the alternate roadmap is predicting a 7% drop and seemingly more realistic.  Reminding that the Primary Roadmap predicts a low of March 4/5 and the Alternate Roadmap predicts a low Feb 25 - 28 (2013 RoadMaps).

Lets look at my reasons for the S&P finally being ready to start its correction.  This first one using Andrews Pitchfork shows the S&P is ready to meet the mean at approximately 1515 in the Jan 28 - 30th time frame.  I believe that 1508/09 will be the high however either way this first top is here and the reason for this is the Alternate Roadmap had the 28th the actual turn date.   According to the chart, 1440 should be the bottom of the drop meeting the bottom of the pitchfork, however I think we'll get carry through with a 50% Fibonacci level of 1424.  This is my late Feb early March target.


Next you see the trend channel that has developed and will give us some short term signals confirming when the trade is on, a TTT moment.  Shorting an upward break of 1515 might be risky, so potentially a downward break of 1502 would be safer as the trend channel would be broken and start the first wave of the decline, minor support at 1485, but likely first wave hitting 1474 which is the first major support (also noting this is the 18 MA).


The next chart shows basic fibonacci levels using the November Low and my projected high of 1508.  I'm suggesting that we will at least see 1424 which is a 50% retracement and where I will start my first long position.  The ultimate would be 1405 (61.8% retracement) and where my final long batch would be bought.


I'm also noting that some blogs I've read had January 30th using elliot wave analysis at approximately 1503.

Lastly worth noting:

S&P
RSI is at 75, KST is at 40.4 and about to negatively diverge.

RUT
RUT is overbought for the longest period as far as I can see spanning many years by some margin with RSI at 77 and KST has just had a negative divergence. 

TRAN
TRAN is at parabolic overbought levels with RSI at 85 and KST at 87!!!

Reminding I will update my trades in real time in the Trade History section.  Currently trading TZA as I think the drop in the RUT will be larger on a percentage basis during the same time period.

Sunday, 20 January 2013

Charts that make you go hmmmm...


The roadmap is calling for the trend to change down into the March 4th/5th however although this map has proven reliable, this can change and if so then the 2013 roadmap must be questioned.  The end of 2011 into 2012 had a similar divergence so I'm not that worried at the current time, but we still need to watch support and resistance levels along with some other indications.

So with that said, my thoughts haven't changed much since my previous post, this market is about to correct downward in a big way.  Lets see what the following charts are showing us:

S&P
I'm not so sure that this S&P chart is very conclusive.  Yes, its close to over bought and yes the KST is also at an extreme level so we know that a change will happen from levels not far from here, but we also know that it can hang around here for a while.  Why do I think this will change soon?  Well, the 2013 roadmap of course
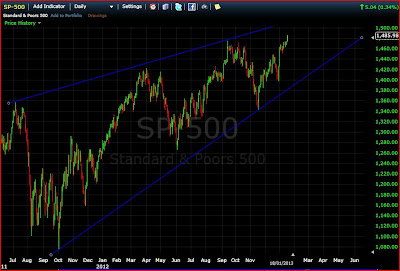
In the bigger picture, you can see what is setting up for after the June high indicated on the 2013 roadmap which appears to be a rather lethal looking rising wedge which I think will resolve to the downside.  Again, time is getting close.


If Friday was the high, then we are looking at some basic fibonacci retracements/support levels at 1453 as a first support and 1432 as the next major support.  These are using the November low, and once we reach the projected June high, we'll look at fib levels from the 2012 low in June.

Now lets take a look at the RUT and TRANS for possible direction

RUT
The situation with the RUT is telling, the KST indicator over the last several months has been quite decisive when it turns, and its looking like that's happening (again at extreme levels, so not surprising).  RSI is at extreme levels also and I think that this rally is already long in the tooth.  This seems to me that it will lead the S&P into its next move down into March.
In looking at fib levels, assuming a top on Friday, 862 then 843 look likely targets, but for a March low I'm thinking roughly 813 now.

TRANS
Given the levels of extremes here, the TRANS is the biggest indicator that this overheated market will have a solid correction. RSI way overbought, KST into major extremes, and combined with everything else discussed above, you have a TTT moment (although I was early with my TZA buy).


Wednesday, 16 January 2013

S&P ready for a correction....


So now that everyone has seen the roadmap, I'm going to focus on the next direction into March 4/5 time frame which I believe is down.   There are a number of signs that are pointing to this, here are my main reasons:

The Nikkei I think is going to plunge and the world markets I think will follow however using other reasons to do it (think debt ceiling).  RSI way overbought for the last 2 months!  You can see the support levels I suspect S1 is the target next -11.4%.  KST is a very reliable indicator which also is reading at extreme levels, and suggesting a solid corrections is next.   There is more, but you get the picture, these extreme readings are eerily similar to March 2012, and from there the Nikkei dropped 19%.

Take a look at this chart:
Nikkei

Now, lets see some more charts:

RUT

TRAN

So, these are the main reasons which give me confidence that the current time would make a good short as we are in overheated markets.....will it lead to a trend change?  Time will tell.  In the correlation chart I'm most confident in, I think we are down into March 4/5th and these charts, are giving me confidence that this is a safe place to short.

I am positioned as indicated in the trade history section which I will post in real time, however want to issue a word of caution.  Do NOT use UVXY as a means to short the market.  You will lose your shirt.  I like TZA at the moment as the last 2 candles have formed a Bullish Harami which is hopefully confirmed tomorrow.

Icing on the cake?


S&P 2013 Roadmap - Until mid June


Firstly, welcome to my blog and my first attempt of a blog of any kind.  I'll cut right to the chase. Important to note that my charts and forecasts are always focused on time rather than price.

I am posting my 2013 Roadmap which takes us to mid June and have chosen not to extend this roadmap because I want to ensure the correlation chart I am using doesn't go off track, making a longer term chart useless if it does.  You'll notice some high and low dates on the chart which I estimate the market will mimic   At the moment, my January 14th top prediction I've been posting on cyclicalmarketanalysis.blogspot.com since mid to late December looks awfully strong noting some of the TA indicators that I like to use when deciding how likely the roadmap is going to be correct are suggesting a turn is imminent.


I will not try to trade the day to day wiggles, but will look at trend and may trade with the trend if I see an overbought situation on the 2 hour chart.   Right now the RUT is in overbought territory with an RSI of 72.63 (has been overbought since Jan 2nd) and its an index that likes to lead the overall market.  KST is another indicator that is also lined up to make a negative divergence at a very extreme reading.  Last but not least the MACD histogram has been over zero for almost 2 months, and that is a good sign that a reversal is imminent.

I am positioned as indicated in the Trade History section which I will update in real time for those who wish to see it, and of course I expect to be judged against my performance since I'm putting it out there publicly.